UX & Revenue
The business case you keep being asked to make
Key Takeaways
UX design directly affects conversion, retention, and support costs – all with a measurable impact on revenue. The business case exists. It just needs to be told in the right language.
In this article
At some point in most UX careers, you’ll be in a room where someone asks: “But what’s the ROI of this?”
It’s a fair question. It’s also slightly exhausting.
Not because it’s wrong to ask – but because the answer has always been there, sitting quietly in the analytics. Users who get confused abandon purchases. Users who can’t find what they need call support. Users who have a bad first experience don’t come back. These things aren’t abstract. They show up in numbers. The problem is that UX teams have historically been better at designing products than at explaining their value in terms a CFO finds interesting.
So let’s fix that.
Where UX and Revenue Actually Connect
There are three places where good UX has a direct, measurable effect on revenue. They’re not secrets. They’re just not talked about enough in the right rooms.
$1 → $2–$100
Every dollar invested in UX returns between $2 and $100 in value.
Most UX improvements cost less than the revenue they recover.
Conversion rates. Every piece of unnecessary friction in a checkout flow, a signup process, or a pricing page costs you conversions. A confusing button label, a form with one field too many, an error message that doesn’t explain how to fix the error – these aren’t aesthetic problems. They’re revenue problems. Improving a checkout conversion rate by even a few percentage points is worth real money, and it often comes down to things that take days to fix.
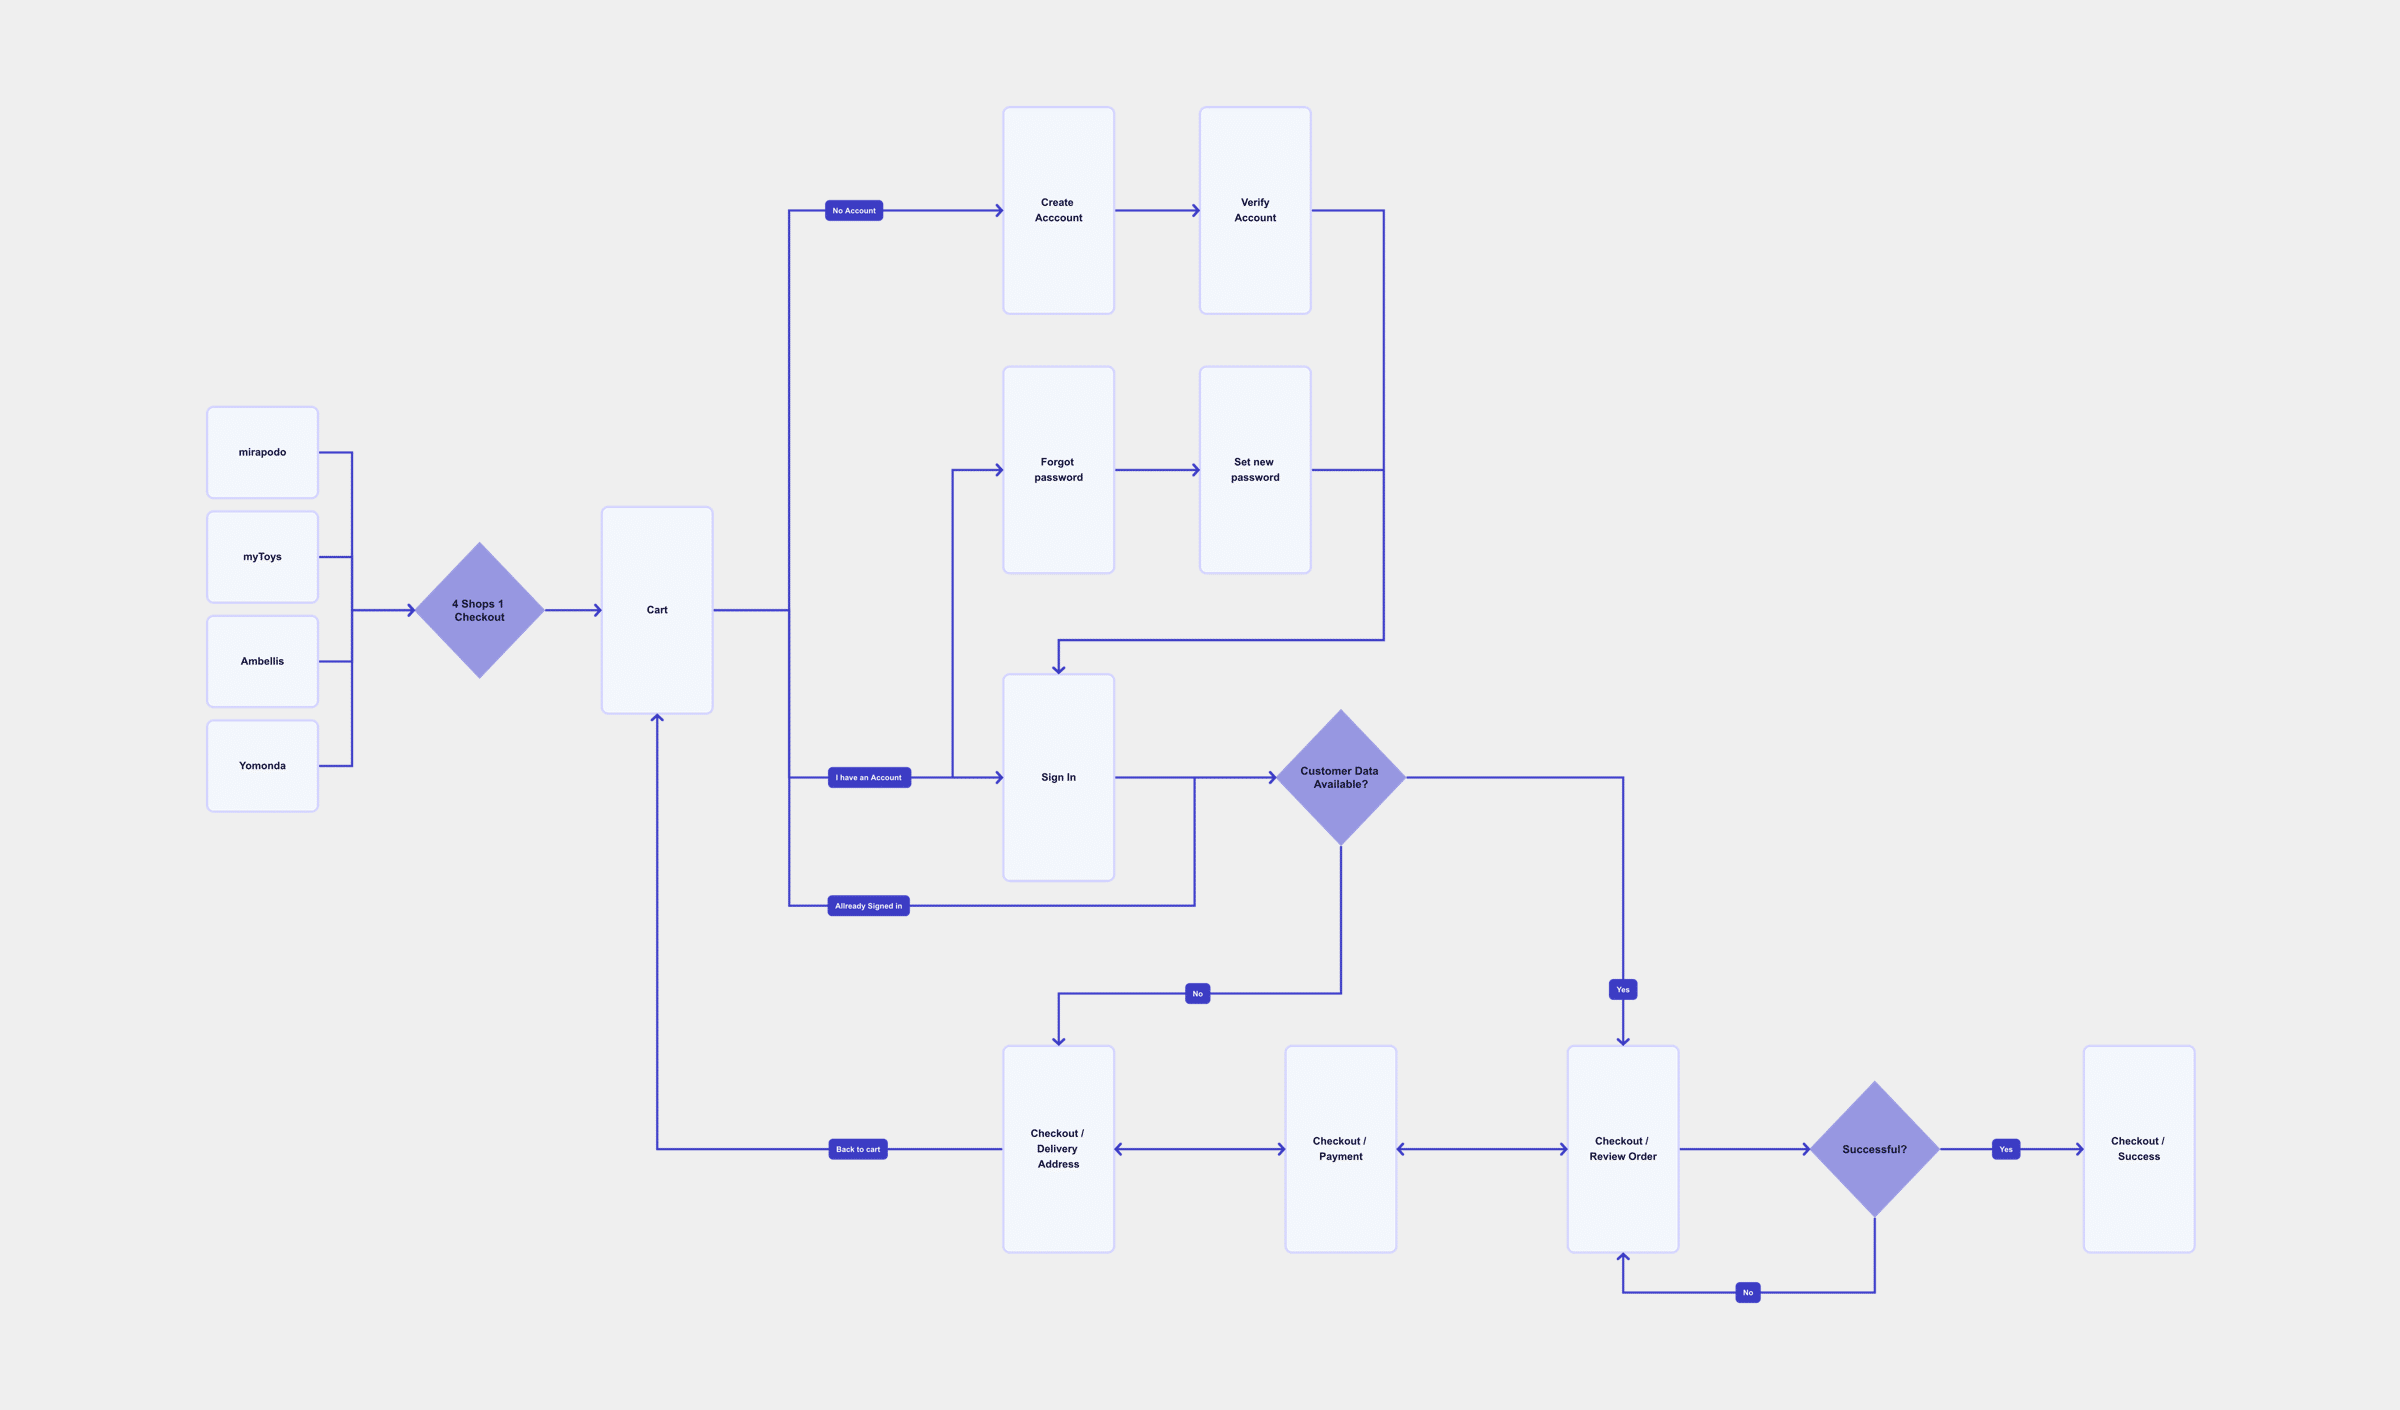
Retention. Acquiring a user is expensive. Losing them because the product is confusing is worse. Users who have a poor experience in the first few days rarely come back. I saw this clearly working on Hello Fresh – a subscription product where every onboarding step was measurable and every early drop-off had a real cost attached to it. The UX of those first interactions wasn’t decoration. It was directly tied to the subscription renewal rate.
Support costs. Every time a user contacts support because they couldn’t figure something out, that’s a UX failure with a price tag. Reduce the confusion in your product, and you reduce the volume of support tickets. It sounds obvious when you say it out loud, which makes it all the more surprising how rarely it gets used as a UX argument.
Good UX doesn’t cost money. Bad UX does – you just don’t always see the invoice.
How to Make the Business Case
The mistake most UX teams make when trying to justify their work is speaking UX. Talking about user flows and heuristics and affordances in a room full of people who are thinking about quarterly targets.
The translation that works: find one metric that’s underperforming, trace it back to a specific UX problem, and put a number on what improvement would mean.
It doesn’t need to be precise. It needs to be plausible. “If we improve checkout completion by 8%, that’s roughly X in additional revenue per month” is a sentence that gets attention. “The checkout flow has several usability issues” is a sentence that gets a polite nod and nothing else.
The data you need for this is almost always already there. Analytics tell you where users drop off. Session recordings show you what happens at those moments. Support tickets tell you what users are confused about. A UX audit tells you what’s wrong and why. Putting those pieces together isn’t difficult – it just requires someone to look at them as a connected story rather than separate reports.
The Numbers Exist
For teams that need something harder than a narrative: Forrester Research found that every $1 invested in UX returns between $2 and $100, depending on the product and where in the process UX was involved. That’s a wide range – but even the conservative end is a compelling argument.
The companies seeing the higher returns aren’t doing anything exotic. They’re catching UX problems before they ship rather than fixing them after. That’s the whole game. And it helps to knowing the number when you’re in the room.
The Number People Actually Remember
There’s a widely cited figure – for every dollar invested in UX, the return is somewhere between 10 and 100 dollars. The range is wide because it depends on the product, the team, and what’s being measured. But the direction is consistent across most serious analyses of UX investment.
The point isn’t to win an argument with a precise figure. The point is that UX investment has a measurable return, and that return is consistently positive when the work is done well and the impact is tracked.
The teams that get ongoing investment in UX aren’t necessarily the ones doing the best design work. They’re the ones who’ve learned to make their work visible in terms the organisation understands.
What to Do Next
- Identify one conversion or retention metric that’s underperforming and trace it back to a specific UX friction point in the product.
- Put a number on it. Estimate what a 10% improvement would mean in revenue or support cost reduction – even a rough figure makes the case concrete.
- Bring that calculation to your next product or business review. UX impact becomes visible when it speaks the language of the room.
Sources & Further Reading
The business case for UX has been documented by researchers and practitioners for decades. These resources helped shape the thinking in this post:
- Nielsen, J. Return on Investment for Usability. Nielsen Norman Group. One of the most-cited pieces on the measurable impact of UX investment.
- Nielsen Norman Group. Usability Metrics. A framework for measuring user experience with quantifiable indicators.
- Nielsen Norman Group. When to Use Which User-Experience Research Methods. Useful context for choosing the right measurement approach at each stage.
- Interaction Design Foundation. Return on Investment (ROI) in UX. IxDF. A topic overview with multiple perspectives on measuring and communicating UX value.
- Baymard Institute. Cart Abandonment Rate Research. Industry data on e-commerce checkout abandonment, useful context for quantifying the cost of UX friction in purchase flows.
- User Interviews. UX Research Field Guide. Includes sections on how to connect research findings to business metrics and stakeholder communication.
René Manikofski is a Senior UX Designer with 10+ years of experience in e-commerce and digital product design across Europe. All articles are based on personal professional experience and supported by AI in writing.