Competitive Benchmarking
Stop guessing where your product stands
Key Takeaways
Competitive UX benchmarking shows you where your product’s experience actually stands – not where you assume it does. It finds blind spots, grounds target-setting in reality, and gives design decisions something to stand on beyond opinion.
In this article
Most competitive analyses I’ve seen are basically feature checklists.
Competitor A has this. Competitor B doesn’t. We have this and that but not the other thing. Nice spreadsheet. Completely useless for understanding the actual user experience.
What a feature list won’t tell you: which of those features anyone actually uses, how easy they are to find, whether they work in a way that makes sense, or whether users who switch from a competitor are relieved or frustrated. That’s the gap competitive UX benchmarking tries to fill.
What It Actually Is
Competitive UX benchmarking is a structured comparison of your product’s user experience against competitors – using real tasks, real users, and measurable outcomes.
You pick a flow that matters. Checkout. Onboarding. Search. Something where users make decisions and where friction costs you conversions or retention. You run that flow across your product and two or three competitors. You measure task success rate, completion time, error frequency, and how users feel at the end. Then you compare.
The result isn’t “our product is better than theirs.” The result is a specific, prioritised list of where you’re behind, where you’re ahead, and where the gap is big enough to matter.
Users don’t evaluate your product in isolation. They compare it to everything they’ve used this week.
Why It’s Worth Doing
The obvious reason: it tells you where you stand. Less obvious but equally important: it changes how teams talk about design decisions.
“This pattern is confusing” is an opinion. “In testing, users completed this task 30% faster on Competitor B because the confirmation step is clearer” is a data point. One gets debated. The other gets added to the roadmap.
Benchmarking also surfaces the things your team has stopped seeing. You know your product too well to notice the friction that’s been there for two years. A structured comparison with unfamiliar products forces that fresh perspective.
And it keeps your standard honest. “Good enough” is a moving target. What was acceptable UX three years ago probably isn’t now, because users’ expectations have been raised by every well-designed product they’ve used since.
30% faster
In testing, users completed the same task 30% faster on a competitor’s product.
That gap is a roadmap.
How to Run One Without Overcomplicating It
Choose two or three direct competitors
Not aspirational ones – actual ones. The products your users are comparing you to, or switching to. Pick one key user flow and keep the task identical across every product you test.
Run sessions with three to five users
Even at that small sample size, patterns emerge fast. If three out of five users fail at the same step, that’s not noise – that’s a problem worth addressing.
Measure consistently across all products
Track task success rate, time on task, number of errors, and a short satisfaction rating after each flow. These numbers become your comparison baseline.
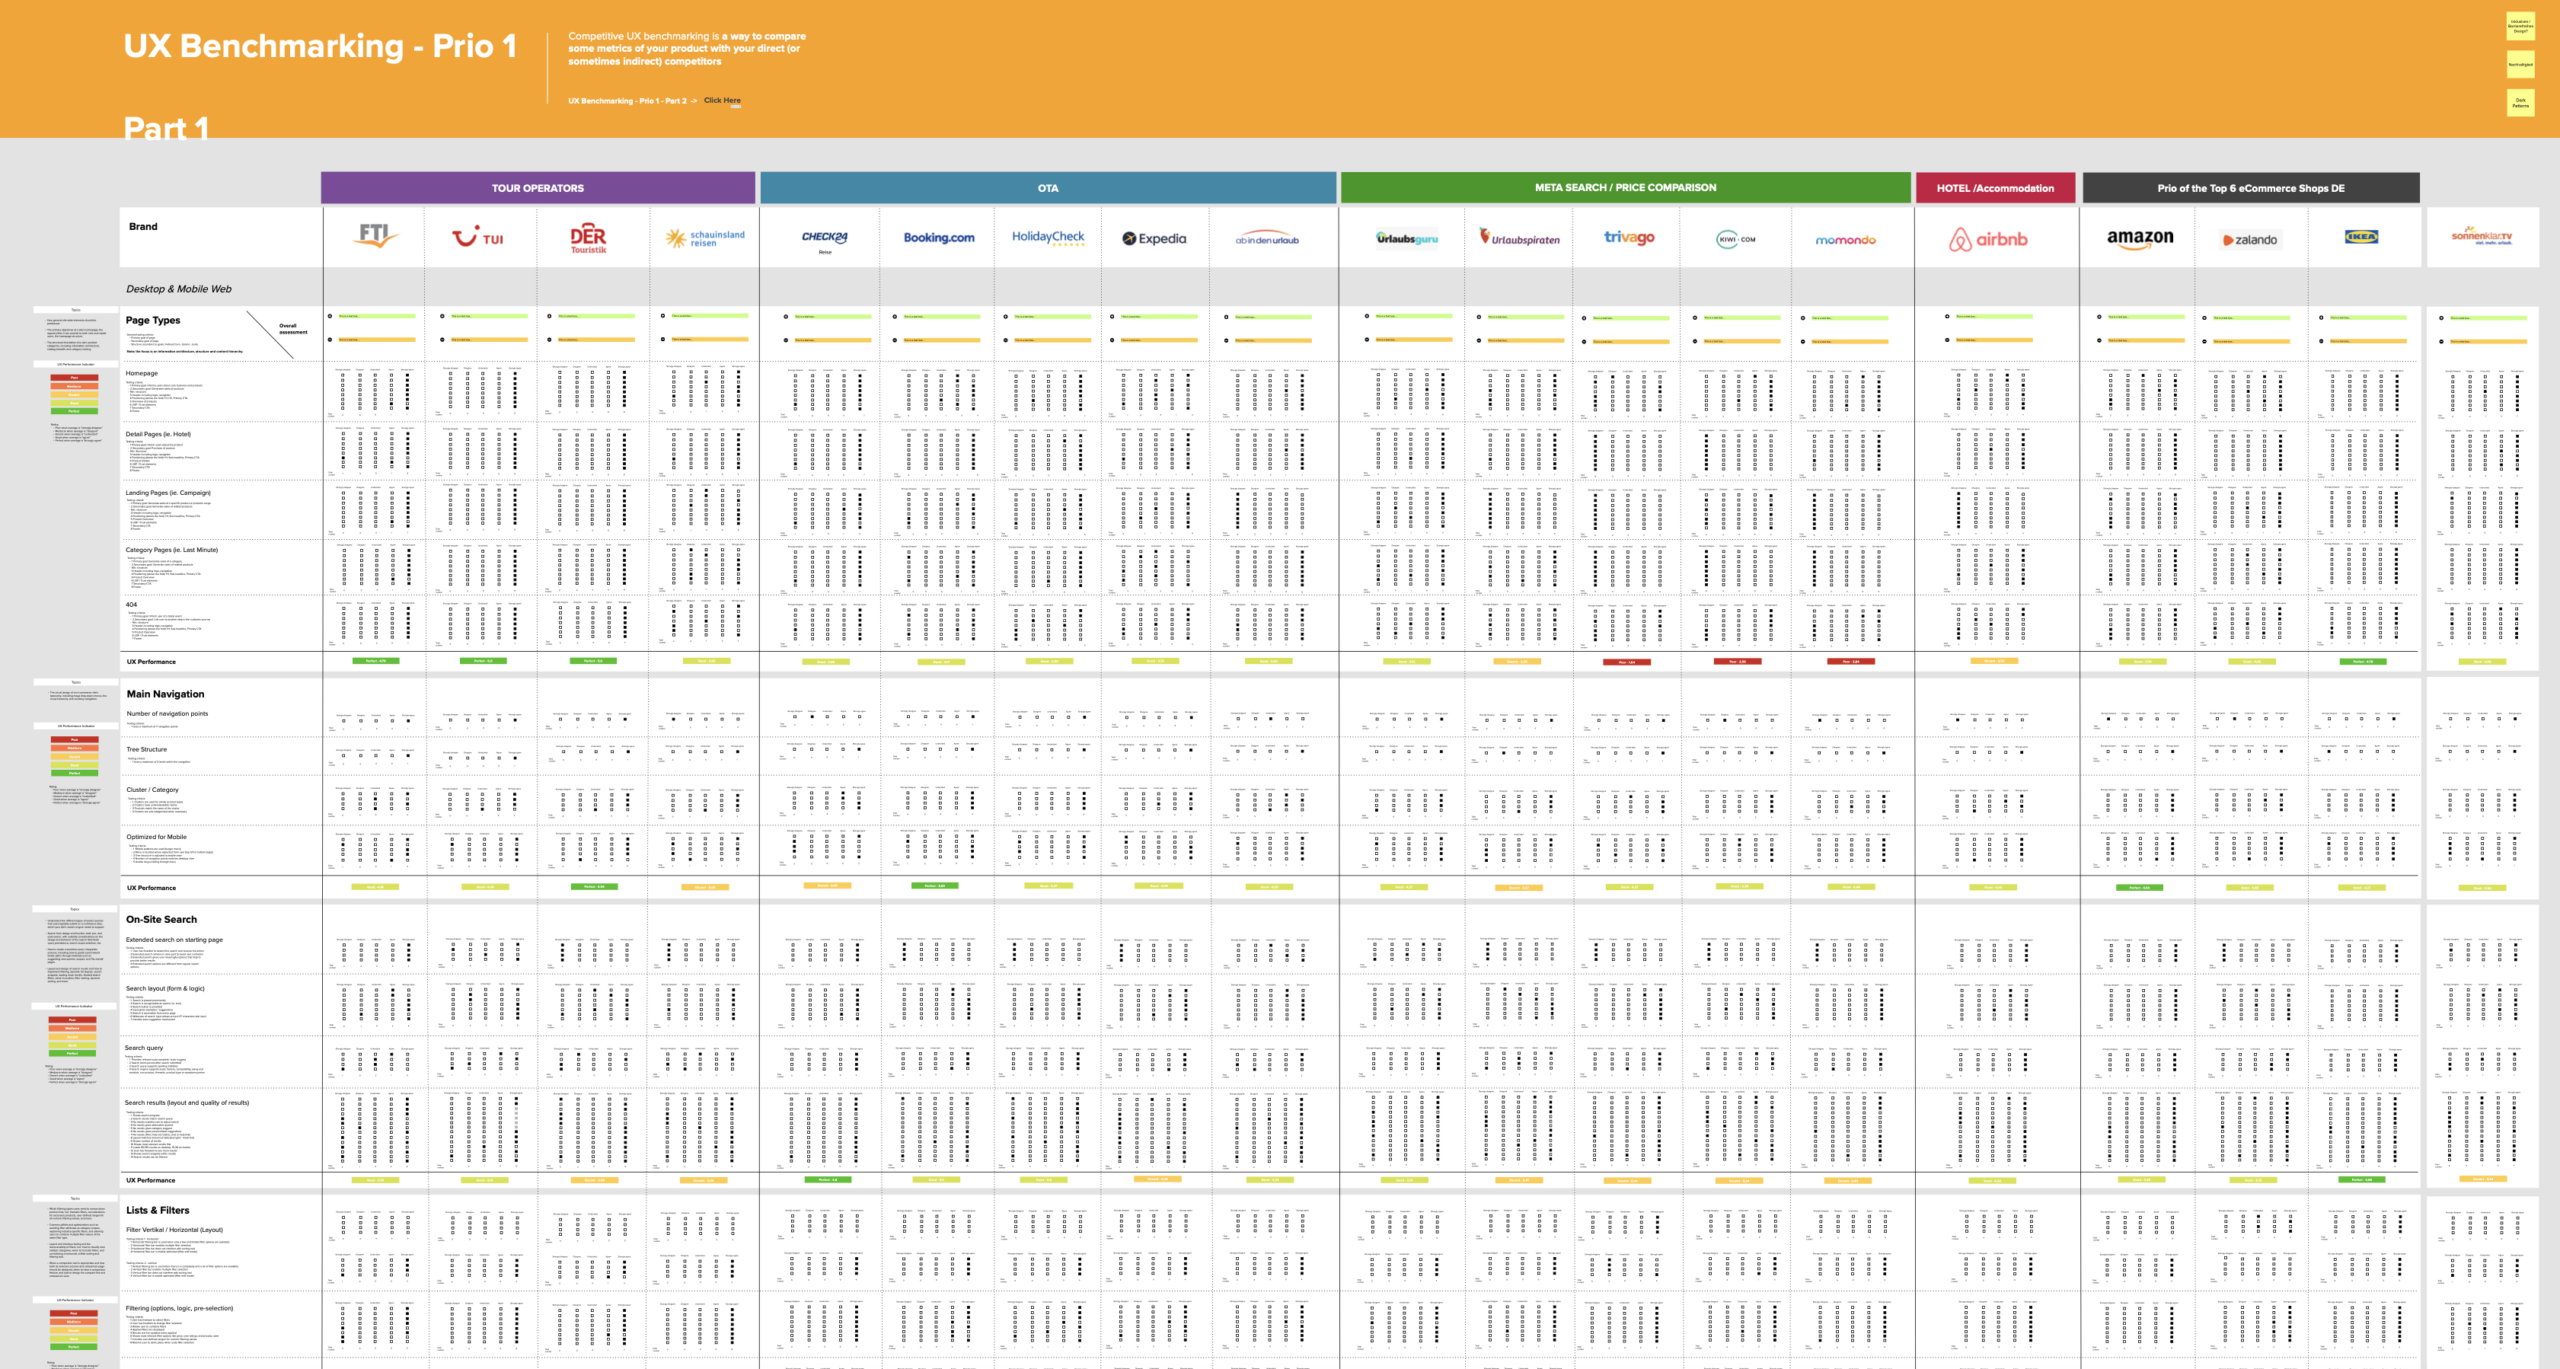
Present findings as a scored comparison, not a report
A matrix showing where you lead, where you trail, and where the gaps are biggest lands better in product conversations than a detailed document nobody reads past page three.
Tools and Complementary Methods
A few things that make benchmarking faster and more credible.
For e-commerce products specifically, Baymard Institute is one of the most rigorous benchmarking references available – 240+ usability parameters measured across 100+ major sites, based on both expert review and real user testing. When they report that the average checkout contains 39 usability issues, that’s a number from systematic research, not opinion.
In practice, Baymard works as a third reference point alongside your own testing and direct competitors. It lets you ask not just “are we better than Competitor B?” but “where do we stand against documented best practice?” – a more stable target. Their most-cited finding: average cart abandonment across e-commerce is 69.8%, with up to 35% of that recoverable through better UX alone.
69.8%
Average cart abandonment rate across e-commerce.
Up to 35% of that is recoverable through better UX – according to Baymard Institute.
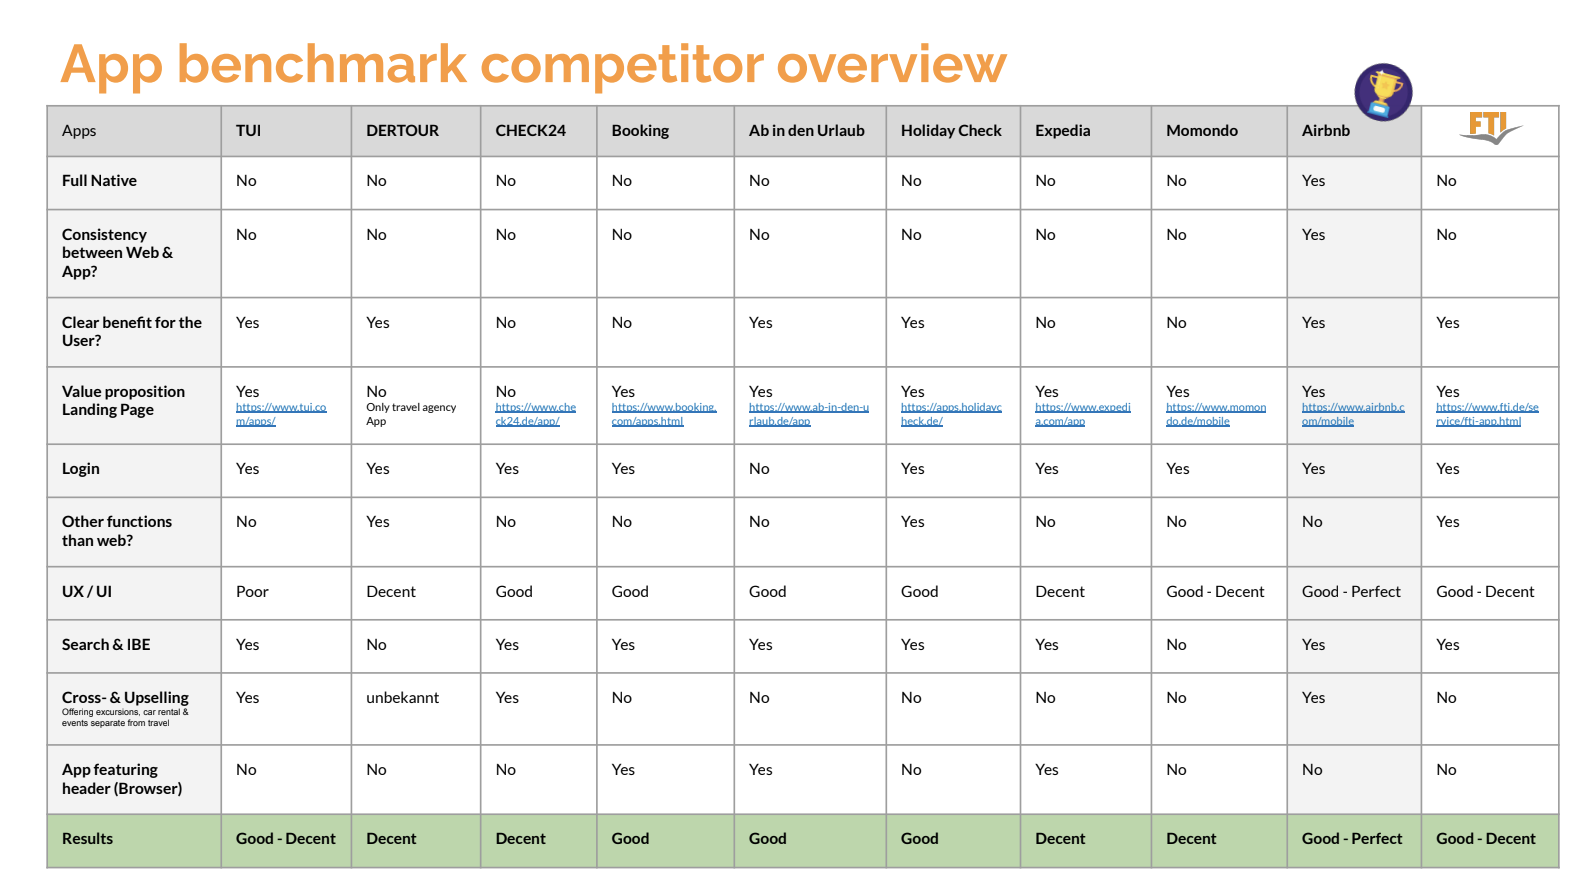
Alongside task-based testing, feature mapping is a useful complementary method – a structured comparison of which features exist across products, how prominent they are in navigation, and what user mental model they assume. It adds context that pure task metrics miss.
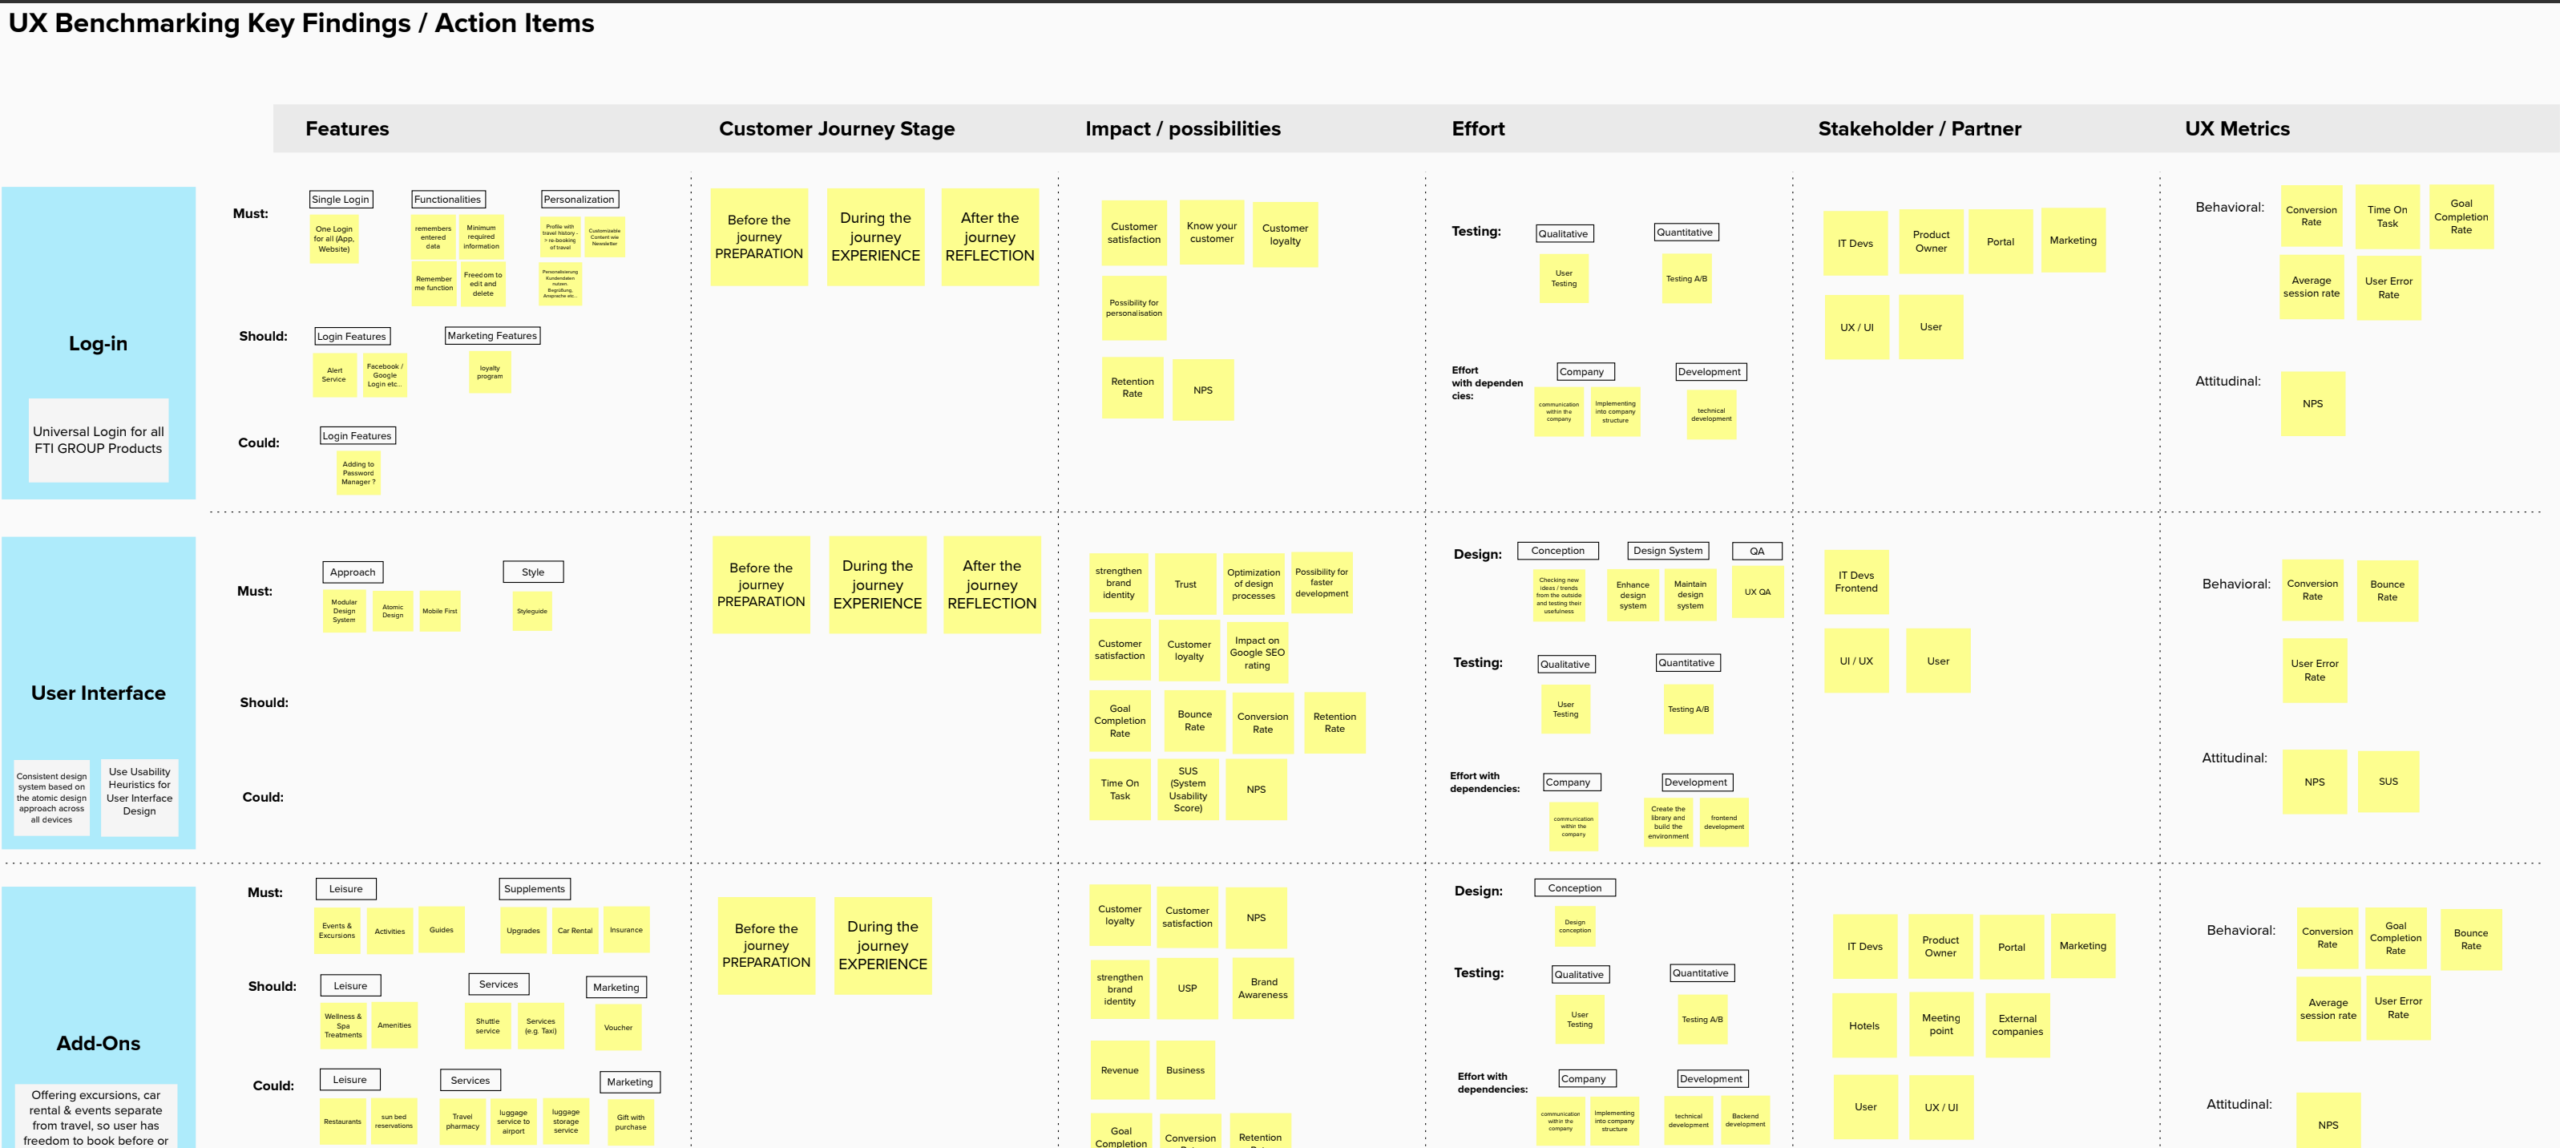
A complete competitive UX evaluation typically draws on six methods: heuristic review, task-based usability testing, feature mapping, first-click testing, satisfaction surveys, and accessibility checks. Most teams don’t run all six every cycle – but knowing the full picture helps you choose the right combination for the question you’re actually trying to answer.
A Few Things Worth Knowing Before You Start
Benchmarking is a snapshot, not a verdict. The competitor that looks worse today might have shipped a complete redesign by next quarter. Build it into your process as a repeatable exercise – at least once a year, or after major releases.
Don’t benchmark everything. The value comes from focused comparison on the flows that matter most to your users and your business. Trying to benchmark an entire product leads to findings that are too broad to act on.
And beware of the trap of benchmarking against a competitor you don’t actually compete with. If your users are comparing you to a direct rival, that’s where your energy belongs – not against a best-in-class product in a completely different context.
What to Do Next
- Pick two or three direct competitors and choose one key user flow to benchmark – checkout, onboarding, or search are good starting points.
- Run a benchmarking session with three to five users this month. Even a small sample reveals patterns that internal review consistently misses.
- Turn findings into a scored comparison your team can act on. Rankings without context don’t move roadmaps – prioritised gaps do.
Sources & Further Reading
Competitive UX benchmarking is a well-established method. These resources go deeper into the methodology:
- Nielsen Norman Group. Benchmarking UX: Tracking Metrics Over Time. The NNGroup framework for structured UX benchmarking, including how to track progress over multiple rounds.
- Nielsen Norman Group. Competitive Usability Evaluations. A detailed guide to running competitive UX studies, from scope definition to presenting findings.
- Nielsen Norman Group. Usability Metrics. Which metrics make sense for comparison across products.
- Baymard Institute. E-Commerce UX Research. The most comprehensive UX benchmarking database for e-commerce – 240+ parameters across 100+ major sites. Key findings referenced in this article: average checkout contains 39 usability issues; average cart abandonment rate is 69.8%; up to 35% of that is recoverable through better UX.
- Laws of UX. Jakob’s Law. The theoretical basis for why users compare your product to competitors: they spend most of their time on other interfaces and form expectations accordingly.
- Interaction Design Foundation. UX Research Methods. IxDF. An overview of research approaches, including those applicable to structured competitive evaluation.
René Manikofski is a Senior UX Designer with 10+ years of experience in e-commerce and digital product design across Europe. All articles are based on personal professional experience and supported by AI in writing.